
R語言ggplot2實現帶y值顯示條柱、函式式註釋、資料點帶誤差顯示
cc139ggplot(cc139,aes(x=year,fill=year)) + geom_bar() + #,label=count labs(x=‘年份’,y=‘超過39℃的天數’,title=‘’) + ...
cc139ggplot(cc139,aes(x=year,fill=year)) + geom_bar() + #,label=count labs(x=‘年份’,y=‘超過39℃的天數’,title=‘’) + ...

編寫程式碼,生成以下各圖...

ggplot(data = mpg) + geom_point(mapping = aes(x = displ, y = hwy), color = “blue”)正確的藍色散點圖...
p2 # Or if we don’t use %# Next, I will add a heatmap layer on the p2 using `geom_tile` of ggplot2...

5)## `geom_smooth()` using method = ‘loess’ and formula ‘y ~ x’ggplot(dat, aes(x, y, group=group, color=factor(group))) ...

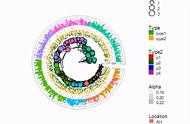
chl library(ggridges)data(“GlobalPatterns”)GP 600, GP)sample_data(GP)$human % filter(Abundance < 120) %>% sel...

Themes:theme_ipsum: Arial Narrowtheme_ipsum_gs: Goldman Sans Condensedtheme_ipsum_es: Econ Sans Condensedtheme_ipsum_rc:...